Gold prices have surged to new heights in 2025, but technical indicators are flashing caution. A recent shooting star candlestick pattern has emerged, signaling potential exhaustion in the uptrend. Additionally, the Relative Strength Index (RSI) has reached levels not seen in decades, suggesting that gold may be overbought and due for a correction.
Understanding the Shooting Star Pattern
The shooting star is a bearish reversal candlestick pattern that appears after an uptrend. It is characterized by a small real body near the low of the session, a long upper shadow, and little to no lower shadow. This pattern indicates that buyers pushed prices higher during the session, but sellers took control by the close, driving prices back down. Traders often interpret this as a sign that upward momentum is waning and a reversal may be imminent.
RSI: A Closer Look at Overbought Conditions
The RSI is a momentum oscillator that measures the speed and change of price movements. Traditionally, an RSI reading above 70 indicates that an asset is overbought, while a reading below 30 suggests it is oversold. Gold’s RSI has recently soared to nearly 90, a level not seen in 45 years, indicating extreme overbought conditions.
While high RSI readings can persist in strong uptrends, they often precede price corrections, especially when accompanied by other bearish signals like the shooting star pattern.
Analyzing Gold’s Recent Price Action
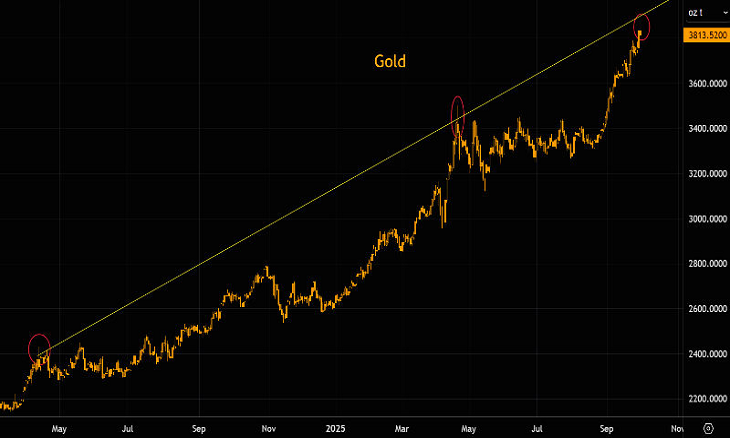
Gold’s recent price movement has been characterized by rapid gains, driven by factors such as economic uncertainty and inflation concerns. However, the appearance of the shooting star pattern at these elevated levels suggests that the buying pressure may be losing steam. Combined with the overbought RSI, this indicates that gold could be poised for a pullback.
Key Levels to Watch
Traders should monitor key support levels to assess the potential for a correction. If gold’s price falls below these levels, it could confirm the bearish reversal signaled by the shooting star and RSI. Conversely, if gold maintains its position above these support levels, the uptrend may continue, albeit with caution.
Conclusion
While gold’s long-term prospects remain strong, the current technical indicators suggest that a short-term correction may be on the horizon. Traders and investors should exercise caution and consider adjusting their positions accordingly. As always, it’s essential to use a combination of technical analysis tools and fundamental insights to make informed decisions in the market.