The U.S. housing market has been the subject of intense scrutiny throughout 2025. A new U.S. housing heat map reveals a clear trend: momentum is cooling in many regions, and potential buyers are sitting on the sidelines as they wait for the Federal Reserve to begin cutting rates. This housing market deceleration is reshaping buyer sentiment, seller strategies, and long-term housing affordability.
Housing Heat Map: What It Shows
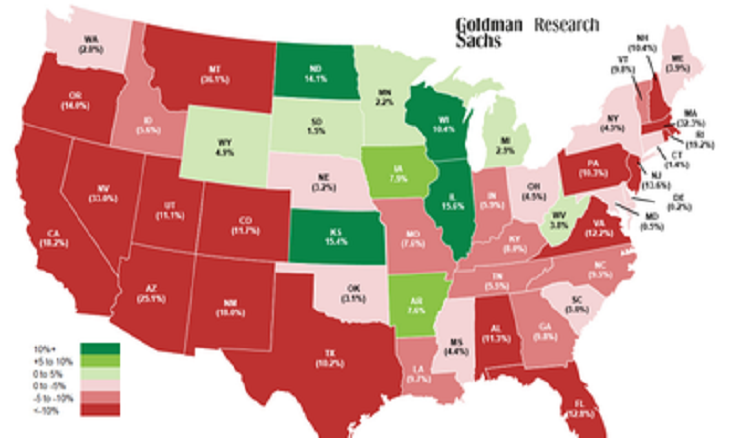
A housing heat map uses regional data on home prices, inventory, mortgage rates, and buyer activity to provide a snapshot of market health. According to the latest reports, markets that were once red-hot—like Phoenix, Austin, Boise, and Tampa—are now showing signs of slower appreciation and higher inventory.
Meanwhile, historically stable regions such as the Midwest and parts of the Northeast remain resilient, though they too are cooling compared to 2021–2022 levels.
Key insights from the heat map include:
- Price growth slowing: Year-over-year home price gains have fallen below 2% nationally.
- Inventory rising: Active listings are up more than 15% in several major metros.
- Buyer activity weakening: Mortgage applications remain at multi-year lows.
Why Buyers Are Waiting
The biggest factor behind the slowdown is interest rates. After hitting multi-decade highs in 2023 and 2024, mortgage rates have eased slightly but remain elevated above 6%. Buyers expect that the Fed will eventually begin cutting rates, which could bring 30-year mortgage rates closer to 5% or below.
This “wait and see” mentality is creating a standoff between buyers and sellers:
- Buyers don’t want to lock in at higher borrowing costs.
- Sellers are reluctant to lower prices, especially if they already have low fixed-rate mortgages.
As a result, transaction volume has dropped, even as more homes sit on the market.
Regional Housing Market Trends
West Coast
Markets like San Francisco, Seattle, and Los Angeles are seeing modest declines in home values. Tech layoffs and high mortgage rates have cooled demand, though inventory remains tight.
Sun Belt
Cities such as Phoenix, Austin, and Las Vegas—which were among the fastest-growing during the pandemic—are now showing the sharpest slowdowns. Investors have pulled back, and buyers are holding off until rates drop further.
Midwest & Northeast
Areas like Cleveland, Pittsburgh, and Boston are faring better, with stable demand and lower volatility. Affordability in these regions has helped cushion against sharper declines.
The Role of Mortgage Rates in the Housing Market
Mortgage rates are the single most important factor driving housing demand in 2025. A one-percentage-point drop in the average 30-year fixed rate can save buyers hundreds of dollars per month.
For example:
- A $400,000 mortgage at 6.5% costs about $2,528 per month.
- The same mortgage at 5.5% costs about $2,271 per month.
This difference of nearly $3,000 per year explains why many buyers are waiting for the Fed’s next move before committing to home purchases.
What This Means for Sellers
For sellers, the housing heat map signals a more competitive environment ahead. Homes that once attracted multiple offers in days are now sitting on the market longer. To stand out, sellers may need to:
- Price homes more competitively.
- Offer buyer incentives, such as covering closing costs or rate buy-downs.
- Focus on staging and presentation to attract cautious buyers.
Housing Market Outlook for 2025
Most analysts believe the U.S. housing market will remain in a holding pattern until the Federal Reserve signals clear rate cuts. While affordability remains stretched, a gradual decline in rates could bring buyers back in late 2025 or early 2026.
Until then, the heat map data suggests a continued deceleration in price growth and sales volume. The housing market is not crashing—but it is normalizing after years of volatility.
Final Thoughts
The U.S. housing heat map makes one thing clear: buyers are waiting for lower mortgage rates before making their move. For now, the housing market slowdown reflects cautious optimism rather than panic. As soon as borrowing costs begin to fall, we may see renewed activity—but until then, the cooling trend is likely to continue.